Dataiku Everyday AI | Introduction to Dataiku

Dataiku
Introduction: -Dataiku DSS (Data science studio) is an AI platform that enables Data professionals to work collaboratively to design, Develop, Deploy, and manage their Data Applications.
Dataiku was founded by Florian Douetteau Clément Stenac Marc Batty Thomas Cabrol in 2013 in Paris, France and after rapid growth in 2015 they established in the US.
Dataiku Has more than 90 features which we will be discussing in the upcoming article.
Dataiku Key Terms: -
In this article, we will go through the most important Terms used in Dataiku and will have a better idea about Dataiku DSS
Design Homepage: -After login to the Dataiku page you will be landed on the Dataiku homepage where you can see the list of projects, workspaces, folders,

Here you can see the application menu, where you can see all the links of instance level elements and you can access them.
Also, you can see a search bar, which is known as global search, it will be on the top right side. The global search bar enables you to quickly find and navigate to many different types of Dataiku elements, it searches across the instance level including help pages, and Dataiku items like datasets and recipes, screens, and settings within the instance.
Workspace: - This is the area where we can share different kinds of objects from different projects with our team with proper permissions. Different kinds of objects like Applications, dashboards, web apps, datasets, and wiki articles. In addition, external links can also be shared in a workspace.

Project Homepage: - It is the project command center where we can see no. of Datasets, Recipes, Notebooks, Dashboards, Articles, Models, analysis, wikis, etc. Also, we can see the project timeline, link to the activity, project metrics, the project's overall status, and contributors including project description, notes, TO Do list.
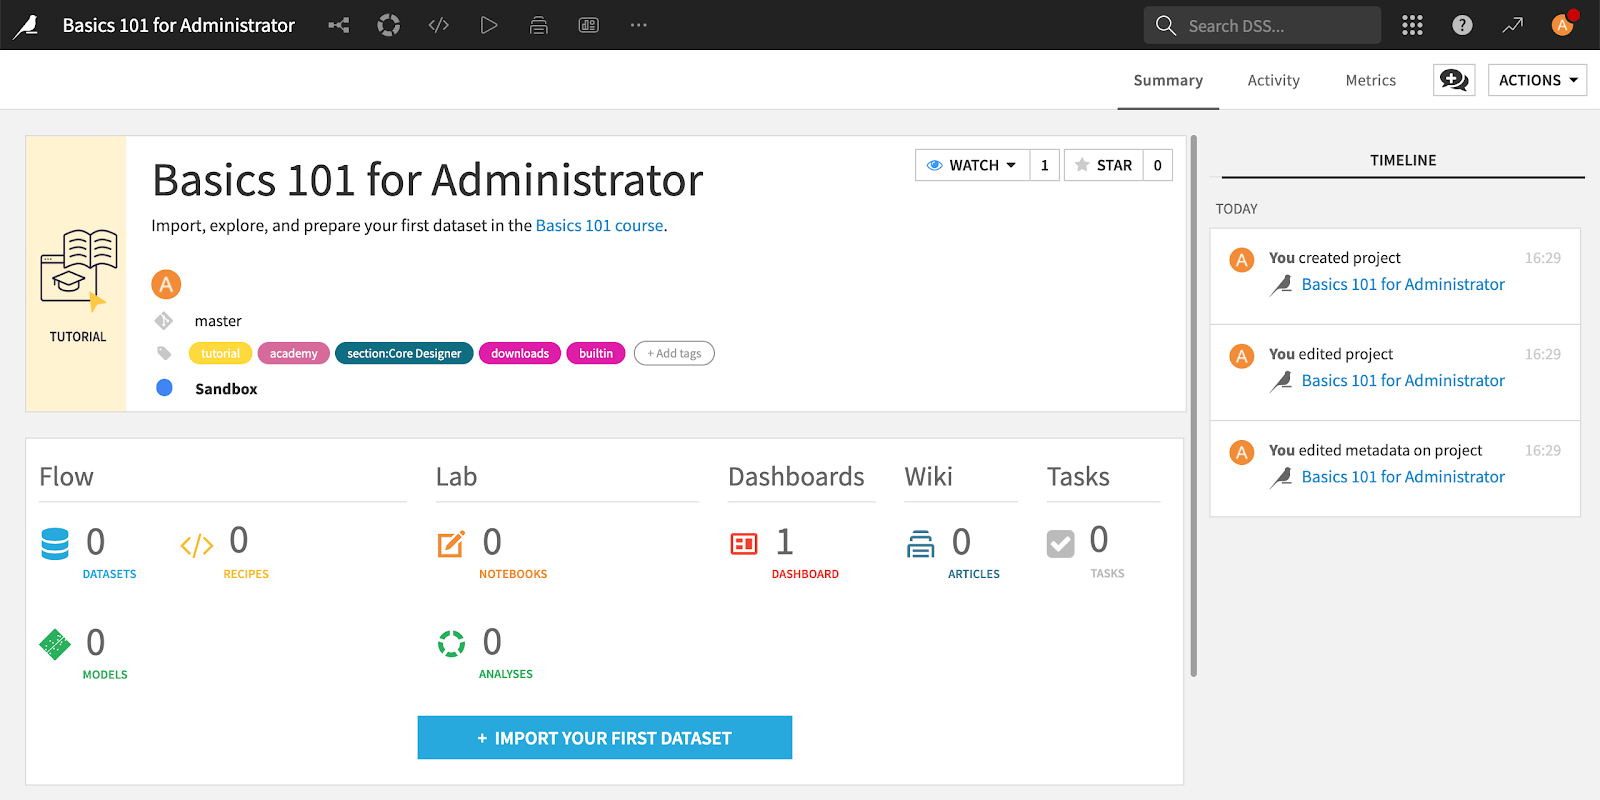
Note: - You should have proper permission.
Project Menu bar/Navigation bar: - Here we can see all the important links to relate to the project. We can move different areas like flow, Datasets, recipes, Jobs, scenarios, notebooks, web apps, etc.
Flow: - It is the first item in the menu bar which the visual representation of your data pipeline is and how data transforms from one form to another. Including the recipes, datasets, and the elements used for data transformation.
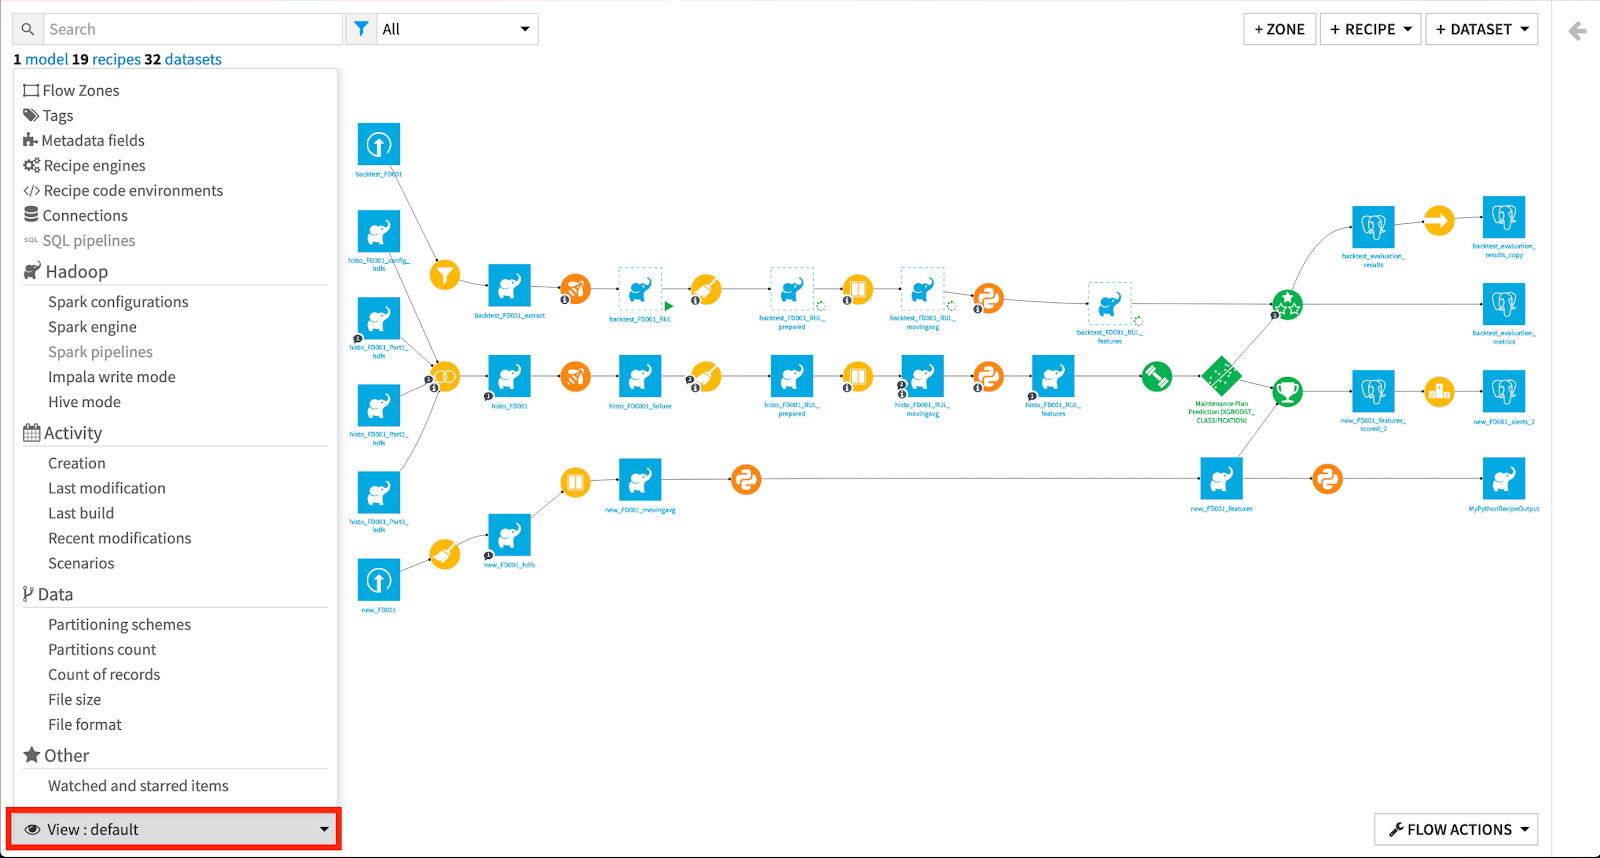
If we look at the right-side panel, we can see a couple of icons, and if we click on any item in the flow some of the icons will increase. and if we open that sidebar, we can see a lot of options to check the data, maintain the quality, select the elements to create the pipeline, and many more. We can discuss this when we discuss the elements of the flow such as Datasets and recipes.
If we look at the bottom left corner we can see a drop-down, if we click on that we can see a lot of options to get the information about the flow.
We can get information about the zones, the tags and recipes, connections, engines, datasets, sources, the activity of the project, and many more.
Similarly, if we look at the bottom right corner we can see the flow actions drop-down where we can see some of the important action items such as copying flow items to another zone, build all to build the entire flow, check consistency, We can export flow in PDF/image, Export documentation.
Sometimes flow can be huge and become complex and difficult to analyze their Flow Zone comes to picture.
Flow Zone: - I can say it is a display item, which helps to understand and helps to make the flow more structured. Where we can split our entire flow into different zones.
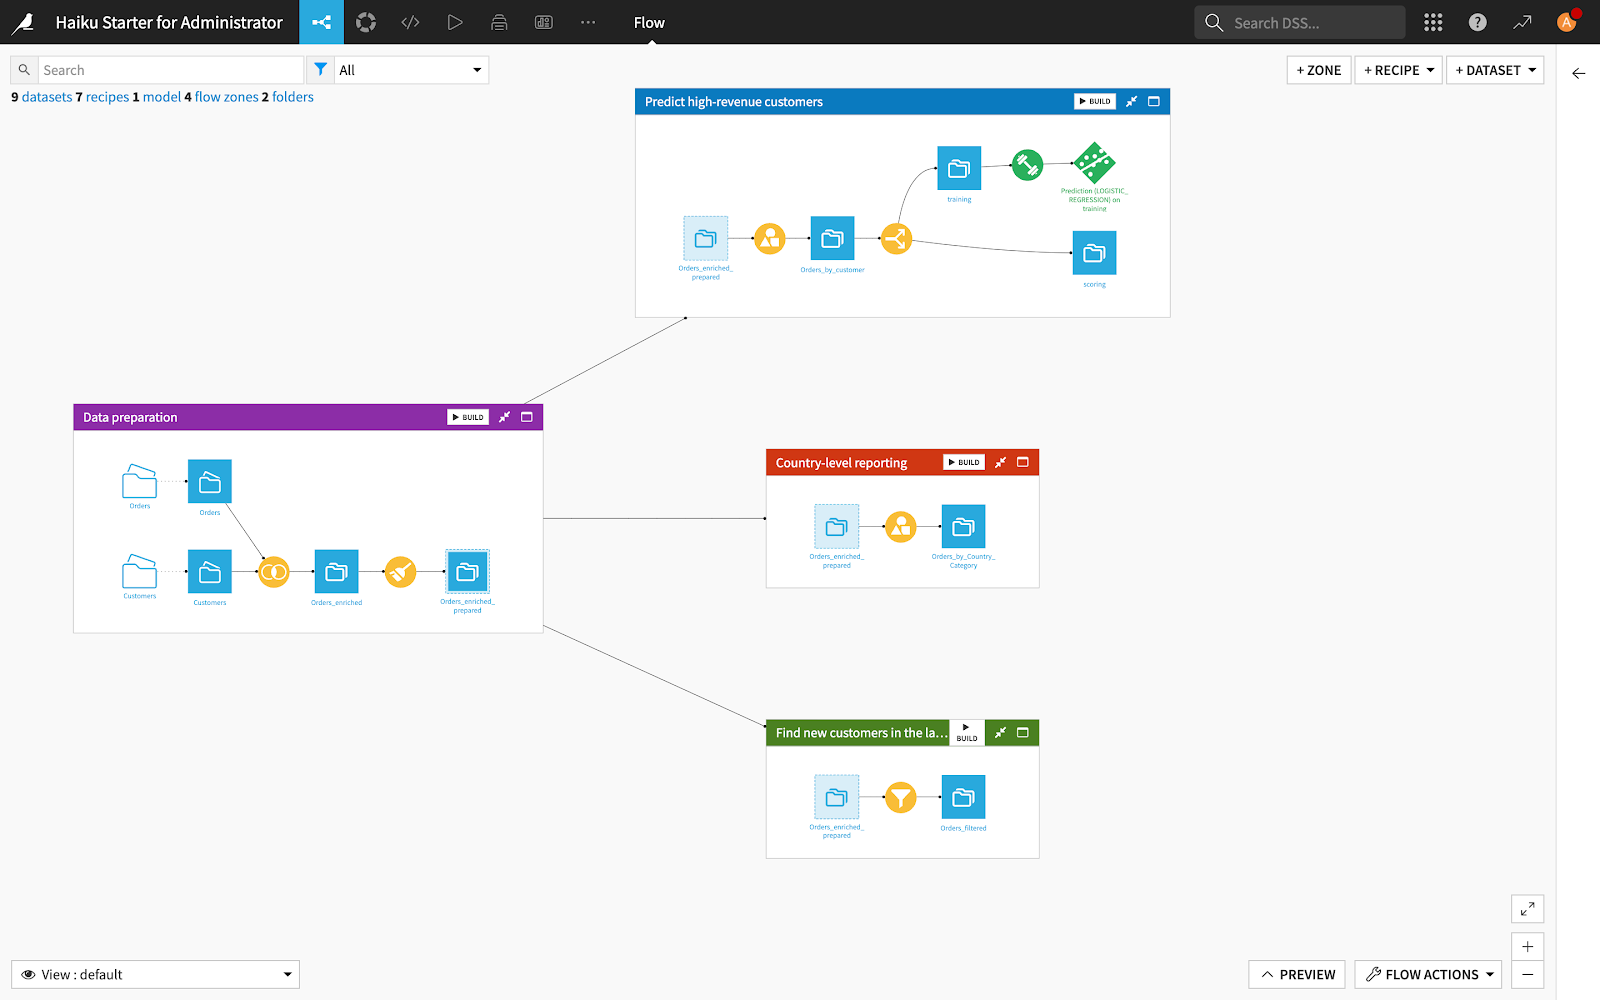
If we click on the flow zone and open the sidebar we can see multiple options to manage the zone, such as
Open: - we can open the zone in full-screen
Edit: - we can edit the zone
Build: -we can build all the datasets inside the zone
Tag: - - this icon helps to improve the readability of the flow and zone. Where we can assign some tags which help to understand better.
Copy: - we can copy flow zone items to another flow.
Delete: - we can delete the entire zone. N don’t worry all your elements like recipes and datasets will be moved to the default zone.
Collapse /Collapse all: - we can collapse the entire zone to see the complete screen or other zones.
Expand all: - similarly we have the option to expand the zones.
Datasets: -If you are reading this article that means you already must have an idea about datasets, Datasets are pieces of data that could be extracted somewhere or generated during any transformation.
Dataiku has great features when we are talking about datasets. It has a lot more flexibility in connecting and supporting of really great no. of data sources and types of datasets.
Moving to the elements in Flow if we click on the dataset on the top right we can see a huge list of options to create the dataset and as I discussed earlier if we click on any dataset and open the right sidebar.. we will find the great options to work with datasets.
We will have an action tab where we can see many options to manage the datasets, below that we will have a list of recipes to connect with.
Then we will have a details tab where we can all the information about the dataset like when it was created, who created etc.
Next to that, we will have a schema tab where we can see the column names and types of columns.
Then we will have a discussion tab where we can have conversations about the topics with the team.
Lab tab where we can connect the ML Models with the dataset directly.
And at last, we have a timeline tab. where we can see all the changes to the dataset in the timeline
Recipes: -It is the transformation step where data transforms from 1 form to another, it includes processing logic that acts upon the dataset.
Dataiku has a special feature that allows users to transform data with codes or a codeless platform as in users can use their logic and write code to perform transformation and also same time users can choose to use a codeless platform where user can use the recipes to perform the transformation.
Hence as I discussed recipes are 3 types of Dataiku.
Visual Recipe: - As the name suggests it is a codeless platform where users can perform data transformation through a pre-defined graphical interface, without any code users can perform such tasks as cleaning, grouping, or filtering.
Code Recipe: - If the user doesn’t want to use a visual recipe they can choose for code recipe where the user can write their own code using Python, R, and SQL to operate.
Plugin recipe: - We can say this is a little more advanced topic for coders who want to extend the capabilities of Dataiku...I mean here they can install and use plugins from Dataiku where they don’t have to write code... Also, they can write code and create their plugins to use in multiple projects like another visual recipe.
Jobs: - Dataiku creates a job when we build a dataset run a recipe or train a model. It lets us know when a job is running and when it completes
Scenarios: -Scenario is a feature that allows you to automate your task such as building your entire pipeline based on certain conditions.
Scenarios are two types of Dataiku:
Step-based: - Based on the steps defined in the scenario and in the User interface scenario will run sequentially.
Code-based: - Based on the script or Python code written in the scenario it will run.
Scenario Steps: - These are the components that help to get the task automated. Such as building or clearing datasets, training a model, running metrics and checks, sending messages, refreshing the cache, charts, and dashboards, etc.
Scenario Triggers: -
The condition can be the time-based trigger that allows running scenarios in a particular time or particular interval...
The condition can be on change like dataset change or query change that means whenever there will be a change in the dataset it will trigger the scenario to run and build the entire pipeline.
The condition can be custom Python code. It will be based on the code the scenario will run.
Reporters: - It is one more component in a scenario that allows users to send communication based on conditions through different channels. Here the condition can be success, failure warning, or any special condition. Reporter channels can be Mail, Slack, Microsoft Teams, etc...
Lab: The lab is a place for exploratory data analysis (as well as Machine learning) because preparing, visualizing, and modeling data it’s a bit complex process where we need room to explore new ideas and research and experiment.
The need is especially to keep on experimenting with your ideas when an existing flow is already in production.
As a recipe, this also has visual analysis and code notebooks which allows users to explore and experiment in multiple ways so there will be no boundaries. Here also we can use charts, visual machine learning, or programming languages such as Python, SQL, and R.
Webapps: -Webapps are the custom application in Dataiku that provides the functionality to create interactive visualization or custom frontend where the user can interact with the Dataiku project or application from the User interface directly without going more into the technical or flow how it is built.
Dataiku web apps are mostly of 4 types.
Standard web app: - where we will be writing our HTML, CSS, and Javascript code to create the front end, and also we can have a Python backend.
Shiny web apps: - This web app mostly needs to use R for both frontend and backend using the shiny library.
Bokeh web apps: - The Bokeh web app is written in Python for both frontend and backend using the Bokeh visualization library.
Dash web app: - For dash web app user requires a code environment and dash installed in it unlike bokeh dash is not pre-installed… which means we have to install it as per our requirement. Here also the same as bokeh it works for both frontend and backend using package dash plotly.
Charts: - Charts are the visual aggregation of data that provide insight into the relationships in the dataset. It is a drag-and-drop interface where we can create many charts like other visualization tools or platforms. As with others, we have to select the dataset and we have to select the particular chart that we are going to build we have to select the rows and columns for the chart and be done.. you will have your visualization on your screen. Also, we have many options to make it more interactive like filters, tooltips, choosing custom colors, animations, etc.
Dashboards: - Dashboard allows you to share the elements from the project like charts, Tables model outputs, Scenarios metrics/checks outcomes, and many more … it is a one-stop where you can visualize your output and show it in tiles.. The dashboard is made up of slides and each slide is made up of tiles. So the user can arrange the tiles in a grid as needed.
Applications: - Dataiku applications are a way to package the Dataiku project and a reusable application where the user has to give input to modify parameters that will trigger some actions and will get the result. It does not require any coding skills to work on the application as it is an interactive platform
Api Designer: - Api Designer is a section that we can use for creating, designing, and developing APIs
An endpoint is a single path on the API and is contained within an API Service. Each endpoint fulfills a single function.
The API node supports 7 kinds of endpoints:
The Prediction or Clustering endpoint to predict or cluster using models created with the DSS Visual Machine Learning component.
The Python prediction endpoint to perform predictions using a custom model developed in Python
MLflow Prediction: -This endpoint is to predict using imported MLflow models
R prediction: - This perform predictions using a custom model developed in R
Python function: -This endpoint call specific functions developed in Python
R function: -This endpoint call specific functions developed in R
SQL query: -This endpoint perform parametrized SQL queries
Dataset lookup: -This endpoint perform data lookups in one or more DSS datasets
To See all the posts: - Click Here
- Dataiku can support Flat files like CSV/Excel spreadsheets.
- It can support any kind of SQL/no SQL data sources.
- Dataiku supports the folder of data files.
- Dataiku supports data and files from the cloud like Amazon S3 / GCS Bucket.
- And many more
Moving to the elements in Flow if we click on the dataset on the top right we can see a huge list of options to create the dataset and as I discussed earlier if we click on any dataset and open the right sidebar.. we will find the great options to work with datasets.
We will have an action tab where we can see many options to manage the datasets, below that we will have a list of recipes to connect with.
Then we will have a details tab where we can all the information about the dataset like when it was created, who created etc.
Next to that, we will have a schema tab where we can see the column names and types of columns.
Then we will have a discussion tab where we can have conversations about the topics with the team.
Lab tab where we can connect the ML Models with the dataset directly.
And at last, we have a timeline tab. where we can see all the changes to the dataset in the timeline
Recipes: -It is the transformation step where data transforms from 1 form to another, it includes processing logic that acts upon the dataset.
Dataiku has a special feature that allows users to transform data with codes or a codeless platform as in users can use their logic and write code to perform transformation and also same time users can choose to use a codeless platform where user can use the recipes to perform the transformation.
Hence as I discussed recipes are 3 types of Dataiku.
Visual Recipe: - As the name suggests it is a codeless platform where users can perform data transformation through a pre-defined graphical interface, without any code users can perform such tasks as cleaning, grouping, or filtering.
Code Recipe: - If the user doesn’t want to use a visual recipe they can choose for code recipe where the user can write their own code using Python, R, and SQL to operate.
Plugin recipe: - We can say this is a little more advanced topic for coders who want to extend the capabilities of Dataiku...I mean here they can install and use plugins from Dataiku where they don’t have to write code... Also, they can write code and create their plugins to use in multiple projects like another visual recipe.
Jobs: - Dataiku creates a job when we build a dataset run a recipe or train a model. It lets us know when a job is running and when it completes
Scenarios: -Scenario is a feature that allows you to automate your task such as building your entire pipeline based on certain conditions.
Scenarios are two types of Dataiku:
Step-based: - Based on the steps defined in the scenario and in the User interface scenario will run sequentially.
Code-based: - Based on the script or Python code written in the scenario it will run.
Scenario Steps: - These are the components that help to get the task automated. Such as building or clearing datasets, training a model, running metrics and checks, sending messages, refreshing the cache, charts, and dashboards, etc.
Scenario Triggers: -
The condition can be the time-based trigger that allows running scenarios in a particular time or particular interval...
The condition can be on change like dataset change or query change that means whenever there will be a change in the dataset it will trigger the scenario to run and build the entire pipeline.
The condition can be custom Python code. It will be based on the code the scenario will run.
Reporters: - It is one more component in a scenario that allows users to send communication based on conditions through different channels. Here the condition can be success, failure warning, or any special condition. Reporter channels can be Mail, Slack, Microsoft Teams, etc...
Lab: The lab is a place for exploratory data analysis (as well as Machine learning) because preparing, visualizing, and modeling data it’s a bit complex process where we need room to explore new ideas and research and experiment.
The need is especially to keep on experimenting with your ideas when an existing flow is already in production.
As a recipe, this also has visual analysis and code notebooks which allows users to explore and experiment in multiple ways so there will be no boundaries. Here also we can use charts, visual machine learning, or programming languages such as Python, SQL, and R.
Webapps: -Webapps are the custom application in Dataiku that provides the functionality to create interactive visualization or custom frontend where the user can interact with the Dataiku project or application from the User interface directly without going more into the technical or flow how it is built.
Dataiku web apps are mostly of 4 types.
Standard web app: - where we will be writing our HTML, CSS, and Javascript code to create the front end, and also we can have a Python backend.
Shiny web apps: - This web app mostly needs to use R for both frontend and backend using the shiny library.
Bokeh web apps: - The Bokeh web app is written in Python for both frontend and backend using the Bokeh visualization library.
Dash web app: - For dash web app user requires a code environment and dash installed in it unlike bokeh dash is not pre-installed… which means we have to install it as per our requirement. Here also the same as bokeh it works for both frontend and backend using package dash plotly.
Charts: - Charts are the visual aggregation of data that provide insight into the relationships in the dataset. It is a drag-and-drop interface where we can create many charts like other visualization tools or platforms. As with others, we have to select the dataset and we have to select the particular chart that we are going to build we have to select the rows and columns for the chart and be done.. you will have your visualization on your screen. Also, we have many options to make it more interactive like filters, tooltips, choosing custom colors, animations, etc.
Dashboards: - Dashboard allows you to share the elements from the project like charts, Tables model outputs, Scenarios metrics/checks outcomes, and many more … it is a one-stop where you can visualize your output and show it in tiles.. The dashboard is made up of slides and each slide is made up of tiles. So the user can arrange the tiles in a grid as needed.
Applications: - Dataiku applications are a way to package the Dataiku project and a reusable application where the user has to give input to modify parameters that will trigger some actions and will get the result. It does not require any coding skills to work on the application as it is an interactive platform
Api Designer: - Api Designer is a section that we can use for creating, designing, and developing APIs
An endpoint is a single path on the API and is contained within an API Service. Each endpoint fulfills a single function.
The API node supports 7 kinds of endpoints:
The Prediction or Clustering endpoint to predict or cluster using models created with the DSS Visual Machine Learning component.
The Python prediction endpoint to perform predictions using a custom model developed in Python
MLflow Prediction: -This endpoint is to predict using imported MLflow models
R prediction: - This perform predictions using a custom model developed in R
Python function: -This endpoint call specific functions developed in Python
R function: -This endpoint call specific functions developed in R
SQL query: -This endpoint perform parametrized SQL queries
Dataset lookup: -This endpoint perform data lookups in one or more DSS datasets
To See all the posts: - Click Here


Comments
Post a Comment